Possibility of Predicting Major Earthquakes: Activities Before and After the Showa Nankai Trough Earthquakes
-- Retrospective Scenarios Tracking Activities Visualized with the Spatiotemporal ETAS Model -- (Yosihiko Ogata)
Introduction
While there is ongoing debate about the long-term probability predictions of a future Nankai Trough megaquake, did you know that several devastating earthquakes occurred along the Nankai Trough just a few years before we baby boomers (late elderly) were born?
Specifically, there were the Tonankai Earthquake on December 7, 1944 (magnitude 7.9), the Mikawa Earthquake on January 13, 1945 (magnitude 6.8), and the Nankai Earthquake on December 21, 1946 (magnitude 8.0). Although the Mikawa Earthquake was smaller in scale, it was a direct hit type earthquake, resulting in a very high rate of building collapses and severe damage. On the other hand, the M8-class Tonankai and Nankai Earthquakes occurred offshore, causing significant damage due to tsunamis.
The damage from these major earthquakes was severe, but at that time, Japan was in the chaotic period from the end of World War II to just after the war ended, so it seems that they were not reported on a national scale like the Noto Peninsula Earthquake in 2024.
While seismic activity is usually low and aftershocks are few in southwestern Japan, various earthquakes occurred in succession during the early Showa period. Therefore, to use these as references for scenarios and predictions of chain earthquakes, I would like to visualize the seismic activity from the Showa Tonankai Earthquake to the Showa Nankai Earthquake through a video and experience the reality of it.
You can watch the video from the https://www.youtube.com/@yosihikoogata784 on "Shorts" of YouTube. I would like to discuss these data from the perspective of predictability as much as possible and pursue the probability of chain earthquakes occurring.
Earthquakes occur due to fault slips, and the increase in stress applied to another nearby fault during such events is significantly larger than the stress that is steadily accumulated during normal times. Today, using satellite images and GNSS geodetic data, we can observe the rapid movement of the surrounding crust in a short period of time after a major earthquake. As a result, sudden increases in seismic activity in certain areas, or conversely, the abrupt quieting of ongoing aftershocks, can be observed. The "Spatiotemporal ETAS Model" is a statistical model that can visualize over time, through videos, where seismic activity is becoming active, where aftershock decay is progressing, and where quiescence or activation is occurring.
Probability Prediction of Foreshocks in the Mikawa Region
It is necessary to clearly distinguish between precursor phenomena and anomalous phenomena (such as observational states different from normal times or anomalous data values). Precursor phenomena are those that are actually accompanied by earthquakes, while anomalous phenomena are those that we judge from the perspective of probability prediction. Although anomalous phenomena may sometimes be accurate, in many cases they turn out to be false alarms.
What is important in earthquake prediction is the probability that an anomalous phenomenon is a precursor phenomenon. For example, "foreshocks" are only recognized after the main shock has occurred. On the other hand, it is necessary to analyze the characteristics of a group of earthquakes that "might be foreshocks" and develop statistical models that lead to probability predictions of foreshocks.
Additionally, the hit rate of anomalous phenomena relative to the occurrence rate of major earthquakes during normal times is called probability gain. Both probabilities are extremely small, but they vary depending on the location of the anomalous phenomena and the elapsed time, so detailed analysis is required. 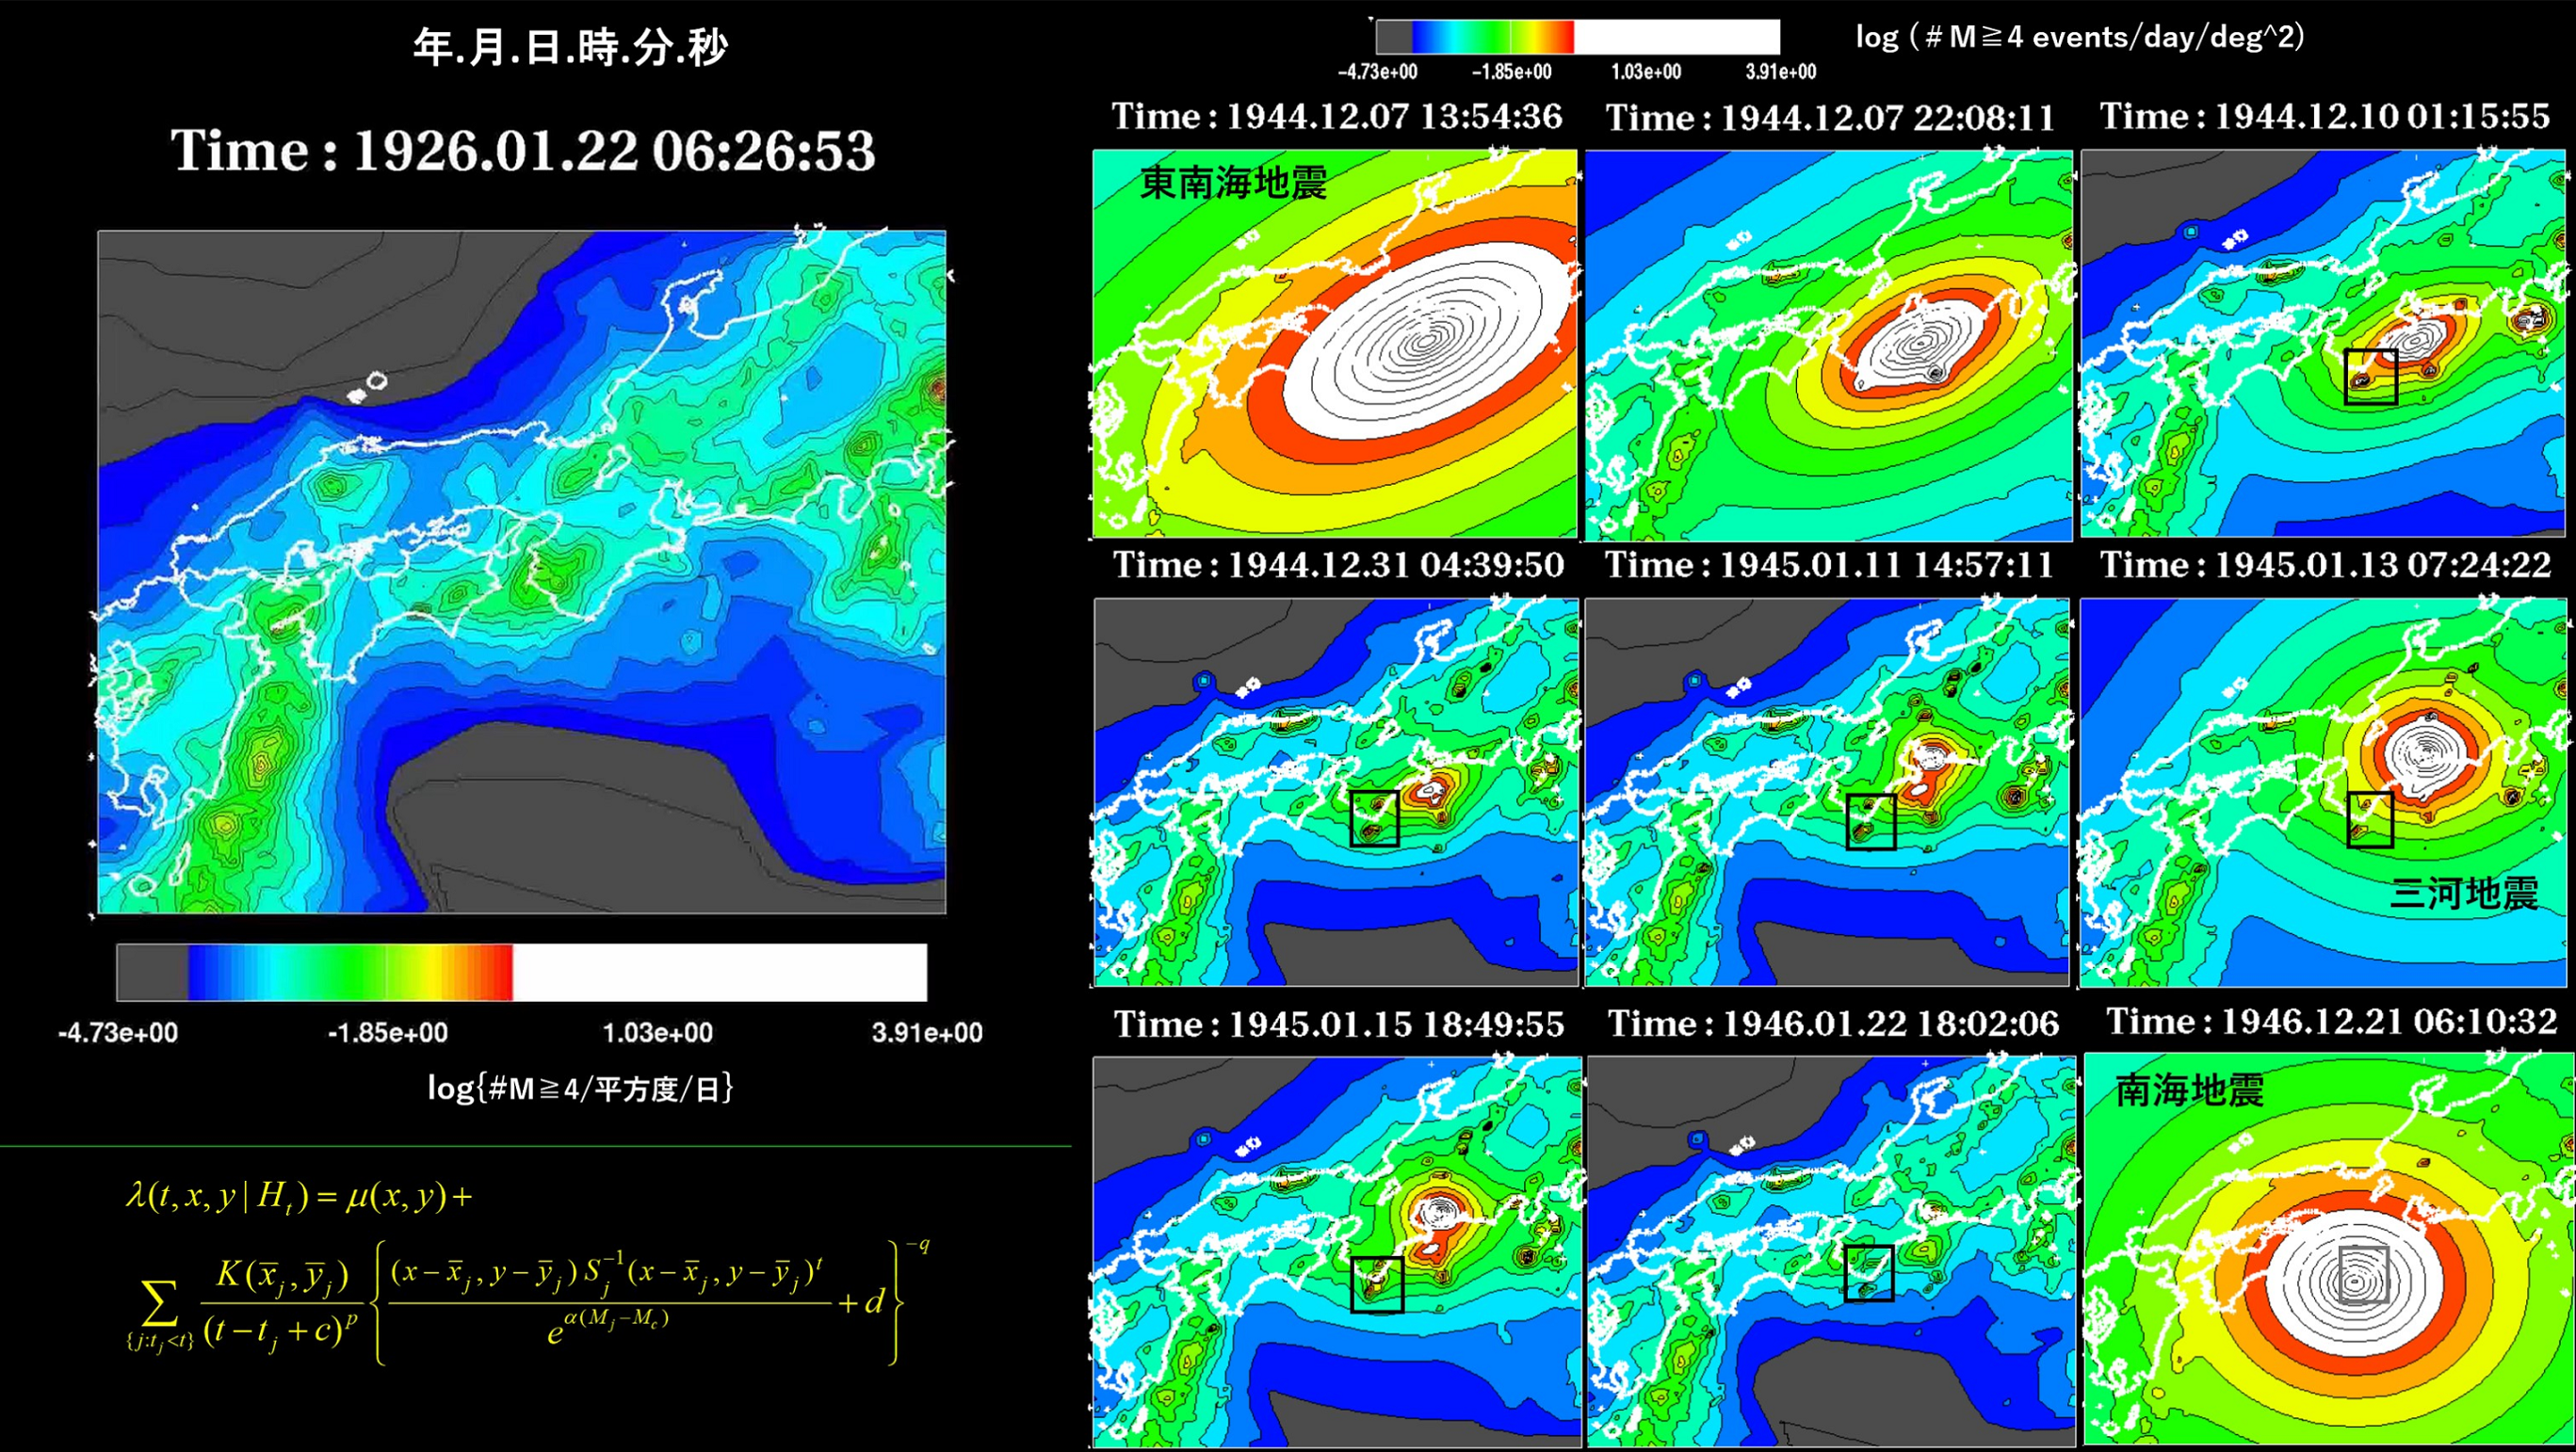
Figure 1: About the Successive Nankai Trough Earthquakes during the Showa Period. (Left) Seismic activity level close to normal times. (Right) Key points from nine frames of video showing seismic activity around western Japan based on the spatiotemporal ETAS model. Note 1: Aftershocks of the Tonankai Earthquake shifted to the Chita Peninsula (referred to as foreshocks), followed by the occurrence of the Mikawa Earthquake. Note 2: In the southern tip of the Kii Peninsula (within the black square), a swarm of earthquakes occurred between the Tonankai and Nankai Earthquakes.
When monitoring seismic activity through videos after the Tonankai Earthquake, we can see that earthquakes land from regions where aftershock activity is subsiding, and eventually activity is observed in the distant northern Mikawa region (refer to slide 5 of Figure 1). We will calculate the probability that these earthquakes are "foreshocks." Specifically, we base our calculations on the maximum earthquake up to each point in the earthquake series of this landing activity and determine the probability that an earthquake more than three times larger will occur in the future. In this series, there have been eight earthquakes of magnitude 4 or greater, with the largest being the fifth earthquake with a magnitude of 5.7. According to the calculation method by Ogata et al. (1996, Geophys. J. Int.), the probability of an earthquake of magnitude 6.2 or greater occurring within one month is 5-9%. Although there is more than a 90% chance of a false alarm, the normal probability of an earthquake of magnitude 6.2 or greater occurring in this region is less than 0.003% per square degree per month, which means a probability gain of more than 2000 times compared to the normal probability. Considering the risk of damage, it can be said that this is a situation that should be closely monitored.
Furthermore, it is believed that the probability gain for earthquake clusters recognized at the boundary of the aftershock zone of a large earthquake, induced by the Tonankai Earthquake, is higher. In fact, statistical estimates of the probability of large earthquakes occurring in adjacent areas after a major earthquake support the following: Once a major earthquake occurs, the probability (per unit area) of an earthquake of similar magnitude occurring nearby is several times higher than the probability of it occurring somewhere far away. This has been demonstrated by empirical statistics and the spatiotemporal ETAS model.
Seismic Swarm Activity Near the Southern Tip of the Kii Peninsula
Additionally, from monitoring the video, there was a noteworthy part as seismic swarm activity near the southern tip of the Kii Peninsula. This area corresponds to the northern part of the epicenter of the 1946 Nankai Earthquake.
In this local area, seismic swarm activity continued consistently until the occurrence of the Nankai Earthquake without a decrease in the aftershock activity of the Tonankai Earthquake (refer to the portion enclosed in small rectangles in slides 2-7 of Figure 1). This is evident not only from the visualized data but also from the occurrence history of more than 300 felt earthquakes recorded at the Shionomisaki Weather Station at that time (refer to Ogata 1996; J. Geophys. Res.).
Currently, it may be possible to confirm the fluctuations in this region through GNSS inversion, but at that time, it is possible that slow slip events (SSEs) occurred in this vicinity. Furthermore, if inclinometers were installed, it might have been possible to observe the time changes due to fluid pore pressure and the involvement of slow slip events.
When these anomalous phenomena are observed, it is important to probabilistically evaluate whether this seismic swarm or slow slip events are post-seismic, precursory, or habitual phenomena.